Late 2023 Ignition on Exoplanet Project
Finally got back to my exoplanet generator project this past week after a ~six month hiatus. I'm still on the galaxy generation portion, and am ready to abuse some tables and figures from the literature. But in a responsible way.
Quick digression: There are broadly two ways to approach generation and simulation of physical systems such as galaxies, stars, and planets. The first, more rigorous and scientific approach, is to define the starting parameters, equations of state, and environmental influences and run a time-evolving simulation of the system itself. This is what real scientists do and get published in real journals. This is the domain of dark matter and galactic hierarchical merging simulations, of detailed simulations of planetary interiors, and of climate models. A mostly bottom-up approach that allows the simulation to take on a life of it's own, with some tweaking of parameter and modeling choices.
The second way varies from "rigorous enough" to all out handwaving, and this approach is more top-down. Look at the results of published research--observations or simulations--and develop a categorization scheme of the objects and effects/dynamics that exist, then implement simple cause-effect relationships between them, and utilize random number generators with an appropriate underlying sampling distribution to choose among them. The results won't be nearly as unique and messily real as the first method, but this second approach is easier (really, who has time to code up genuine simulations of all the physical systems in play from galactic interactions down to atmospheric circulation on a planet? No one). Plus, I can fuzz the results with appropriate noise, and utilize more judicious aesthetic judgements to shape the outcomes of my algorithms.
But in the complexity of actual implementation, there's a third way: Do both! In different places! At different times! Yes, I can combine the two approaches, and am finding that the top-down categorize and parameterize approach works best in most places, but sometimes a genuine (very limited) simulation is needed to get the ball rolling and generate interesting enough rough data to feed into my hand-tuned schemas later on.
This has recently come up as I get back to galaxy generation. I had originally kept separate the generation of dwarf galaxies and major galaxies, and this made sense given the literature's division of them as well. It's hard to observe smaller dimmer things that are far away, so most papers tend to have mass cutoffs and handle different mass categories of galaxies. I followed suit.
But no, that doesn't make sense if I'm trying to generate a procedural universe. Galaxy masses are a continuum, and generating them accurately calls for a single mass/probability distribution to draw from. So I began merging dwarf and major galaxy data sets and ran into a problem: My top-down approach provided the occurrence rates of major galaxy morphologies separate from those of dwarf galaxy morphologies, and it was difficult to merge the two, as the tables started to implicitly contain mass range data that wasn't really designed to work there and would give odd results.
So I revisited my galaxy mass generation routine and realized that I could slightly abuse the tables and figures it relied on to (1) sample across a full galactic mass range, from smallest dwarfs to largest central dominant galaxies and (2) use this same data to simulate the evolution of a galaxy's mass over time. The below figures are the key, and they show the results of a double-schechter fit of stellar mass functions of galaxies ranging from z = 0.2 to 3.0. (Source: Tomczak et al, 2014. Arxiv: 1309.5972)
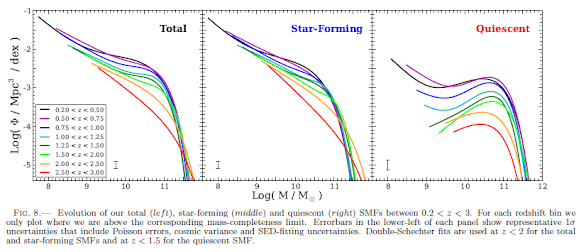
The y-axis above is a density measure, the occurrence of a galaxy of a given mass per cubic megaparsec, with different colored lines giving the distribution at different redshift (higher "z" redshift values means farther back in time, present day is z = 0.0). So I choose z = 3.0 as a starting time and grab the parameters for that line from a table in the same paper. If I squint a bit and normalize the data, the density measures on the y-axis can be sampled as a weighted probability, and I use a random number generator to pick a point on the y-axis. I then get the corresponding x-axis value (which is the log value of the number of solar masses in a galaxy) off the z = 3.0 line and voila! I have a galactic mass derived from actual observations of the galactic population at the given redshift value.
Yes, I mistreat the data and extend the lines further than they are drawn, but I'm not doing science here, I'm kicking the literature until it gives me something good enough.
Now the problem is what to do with this galaxy? See, the time evolution of a galaxy is important. A typical galaxy experiences many events during its lifetime that alter its appearance, the distribution and ages of its stars, the formation rate of its stars, the amount of gas it has available to form new stars, etc. The environments through which it travels matter, as do the interactions it has with nearby galaxies. I could just generate a galactic mass from the above figure at z = 0.0 or whatever time the program is being run at, then create an entire backstory for the galaxy. But believe it or not, that's kind of complicated and, I believe, introduces the possibility of more errors.
No, this is a time to actually run a very simplistic simulation. Start in the galaxy's past, at z = 3.0, place it in a galactic neighborhood (group, cluster, etc., part of a node, wall, or filament). Place galaxies around it (these are already generated, so just use them). Give all the galaxies velocity vectors (already done with node, wall, filament generation). Move time forward and accumulate events! The events themselves aren't strictly simulated, only noted in their details and their impacts.
For example, a major galactic merger has a decent chance of changing the morphology of a galaxy, reducing it's "diskiness" and moving it closer to an elliptical shape. Not always, but some of the time. Another example, a galaxy falling in toward the center of a cluster will have most of its free gas stripped away (ram pressure stripping), reducing its star forming rate and leading to a maybe permanent quiescent phase. This effects the age distribution of it's stars, which in turn effects the age distribution of it's planets, since planets and stars form together. So note where it goes and what it interacts with. Keep it very basic, it's ok to handwave a lot, but there is still a time-evolving simulation underlying all this.
I'm also planning to evolve the total mass of the galaxy by stepping across lines in the figure above. Starting on the z = 3.0 red line at a particular point and evolving toward z = 2.5 orange line, I think I can get away with projecting galaxy mass between the lines as a perpendicular to the z = 3.0 line intersecting the z = 2.5 line at some (usually higher) mass. Over time the galaxy gains more mass, unless it's at the dwarf end where most lines overlap or in the massive galaxy end, where most mass accretion appears to have already happened prior to z = 3.0. Step the galaxy from z = 3.0 to z = 0.0 and see how massive it gets.
After the galaxy acquires its history, use this information to build it in the present day. There may be discrepancies between the mass evolution over time and number of mergers. Since mergers are where galaxies get most of their mass, I'd have to decide to either edit the history a bit to add or remove mergers, or to tweak the mass values and leave the mergers as-is. I'd prefer the latter, but only after running it a bunch to observe the deviations will I know what to do.
And I'm not there yet. Work resumes next Wednesday, if I have time.


Comments
Post a Comment